%201.webp)
02
AI Snaps
.svg)
.svg)
01
Our Work
03
About Us
04
Brand Audit
05
Contact Us
06
Client Success
12
07
Blogs
08
Careers
Book A Call
.svg)



.svg)
Need Help In Building Your Brand?
Click the button below & book a call with our founder directly.

Rishabh Jain
Managing Director
Branding success metrics tell you whether your logo, packaging, and positioning are actually earning you customers or not.
This Confetti blog breaks branding down into four measurable layers and shows how each performs differently across retail, e-commerce, quick commerce, and D2C.
Branding success is hard to measure because branding doesn't work like a performance ad campaign. There's no single dashboard that tells you a rebrand "worked."
Here are a few reasons that make it hard to measure:
A KPI in branding is a metric tied to a specific business goal, with a number and a deadline attached to it.
🔵A metric answers "what happened."
🔵A KPI answers "did we hit what we set out to do."
You can track a hundred metrics and still have zero KPIs if none of them are tied to a target, a timeframe, and a business outcome you actually care about.
Example:
👉Take "increase brand awareness." As a goal, it's unmeasurable. Awareness among whom? By how much? By when?
👉Compare that to: "increase unaided brand recall among urban buyers aged 25-34 in the skincare category from 12% to 20% within two quarters."
The second version is a KPI. It names the audience, the metric, the baseline, the target, and the deadline. You can walk into a boardroom with that number and defend a budget.
This is why D2C founders in India struggle to justify branding spend. When finance asks, "What did the rebrand actually do?" vanity metrics don't provide an answer.
A founder holding a KPI framework can point to a specific movement in recall, in repeat purchase rate, or in price premium tolerance, and connect it back to the money spent.
Examples of shift from weak to strong KPI-setting:
⛔Weak: "Improve brand perception."
✅Strong: "Move brand sentiment score from neutral to positive among Zepto and Blinkit repeat buyers within one quarter, tracked via post-purchase survey."
⛔Weak: "Increase visibility."
✅Strong: "Increase share of voice in the protein bar category from 8% to 15% across Instagram and category search within six months."
⛔Weak: "Strengthen packaging."
✅Strong: "Improve shelf impact score (measured via eye-tracking or in-store audit) by 20% against the top competing SKUs before the next quick commerce listing cycle."
The pattern is the same every time. Name the metric, name the audience, name the number, name the date.
Revenue grows for a dozen reasons in any given quarter, distribution expansion, a competitor's stockout, a festive calendar shift, a platform algorithm change, and your new packaging is just one input among many.
Treating a revenue bump as proof your rebrand "worked" is a common and expensive mistake.
Most D2C and FMCG brands lean on vanity metrics, Instagram followers, page views, impressions, because these numbers are easy to pull and easy to put in a slide.
They don't require a survey, a panel, or a paid research tool.
But followers don't buy anything. Impressions don't tell you whether a shopper chose your SKU over a competitor's.
None of these numbers predict purchase behaviour, and purchase behaviour is the only thing that eventually pays for the branding budget.
The alternative is to track metrics that are closer to the purchase decision:
These move slower than impressions, and they're harder to collect. But they correlate far more directly with revenue. They hold up under scrutiny when someone in finance starts asking pointed questions.
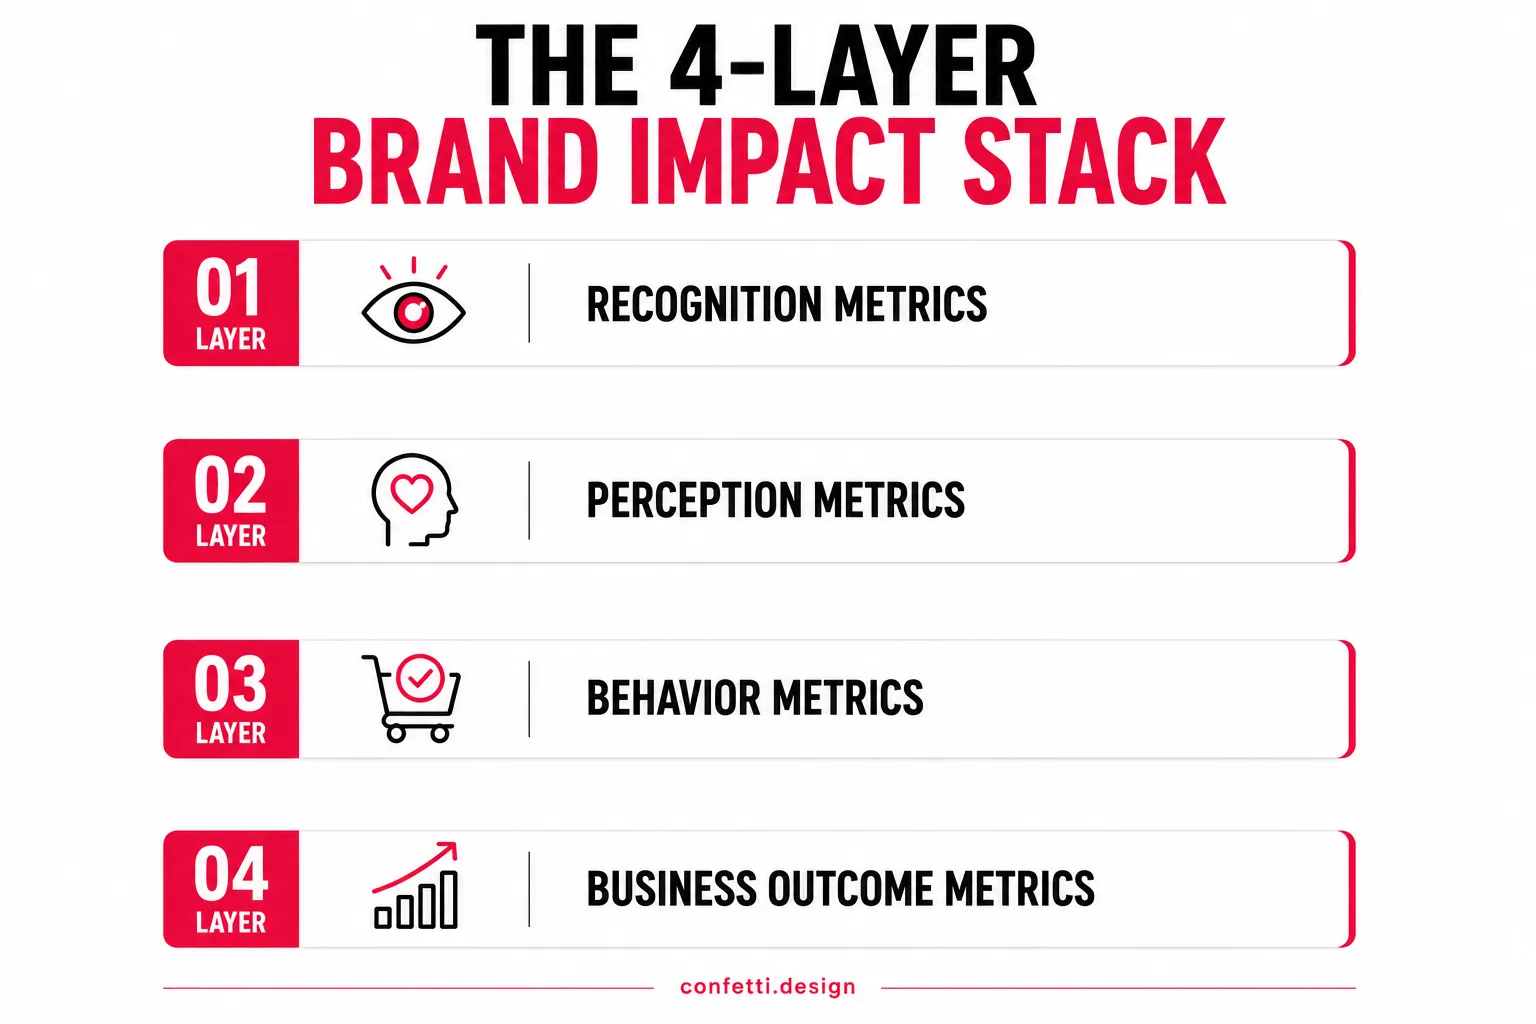
A more useful way to think about it is as a four-layer stack, with each layer feeding the next:
Recognition → Perception → Behaviour → Revenue
Recognition drives perception, perception changes behaviour, and behaviour drives business results. If you're only measuring awareness, you can't tell whether it ever translates into revenue.
Recognition metrics tell you whether people know your brand exists and can identify it correctly.
👉Unaided Brand Recall
The percentage of people who name your brand without being prompted, when asked to list brands in your category. This is the strongest recognition signal because it means you occupy space in memory without a nudge.
👉Aided Brand Recall
The percentage who recognise your brand when shown a list or logo. Easier to achieve than unaided recall, and useful for tracking newer brands where top-of-mind status is still a few quarters away.
👉Logo and Pack Recognition Speed
How quickly a shopper can identify your brand from a partial or brief exposure to the pack, tested using tachistoscopic methods, essentially flashing the pack for a fraction of a second and measuring correct identification.
This is important in India, because quick commerce browsing happens in seconds. A shopper scrolling Blinkit's grid view sees your pack as a thumbnail for under a second before deciding whether to tap it.
👉Share of Search
Your brand's search volume as a percentage of total category search volume. Rising share of search is one of the earliest signals that recognition is converting into intent, well before it shows up in sales data.
Recognition tells you whether people know you exist. Perception tells you what they think of you once they do. This layer is where branding either earns pricing power or fails to.
👉Brand Sentiment
The overall tone, positive, neutral, or negative, of how people talk about your brand across reviews, social mentions, and survey responses.
👉Brand Associations
The specific words and qualities people connect to your brand. "Premium," "trustworthy," "affordable," "for people like me." These associations are what a brand positioning strategy is actually trying to build.
👉Net Promoter Score
Although NPS is traditionally a customer experience metric, it also shows whether your brand identity and messaging are strong enough that customers are willing to recommend you.
A high NPS with weak recall usually means your product experience is doing the work your brand identity should be doing.
👉Premiumness Perception
This measures whether shoppers perceive your brand as capable of commanding a higher price than generic or unbranded alternatives.
For FMCG and D2C brands, this is one of the most important perception metrics because it strongly influences customers' willingness to pay a premium.
Behaviour metrics tell you whether the brand work is actually changing what people do at the point of purchase.
👉Repeat Purchase Rate
The percentage of first-time buyers who return for a second purchase. In Indian D2C, this is usually
Food, beverage, and personal care categories
Fashion and discretionary categories
If your repeat rate sits well below your category benchmark despite strong recall, that's a signal your brand isn't converting attention into loyalty.
👉Direct and Branded Search Traffic Share
The proportion of your traffic that comes from people searching your brand name directly, rather than a generic category term. Rising branded search share means people are seeking you out specifically, not stumbling onto you through paid ads.
👉Add-to-Cart Rate, Owned Site vs Marketplace
Comparing this rate on your own D2C website against your ecommerce or marketplace listings tells you whether your brand identity is doing more work when you control the full page experience.
On a stripped-down platform listing, packaging carries almost the entire brand signal.
👉Quick Commerce Reorder Rate
How often a customer who bought your SKU on Blinkit, Zepto, or Instamart comes back to reorder it, either through the platform's reorder shelf or by searching for you again.
This is a sharper signal than general repeat purchase rate because it reflects behaviour in an environment with near-zero switching cost, where a competitor is one tap away.
If your branding efforts don't translate into business results, they're unlikely to retain support, no matter how strong your awareness or perception metrics are.
👉Price Premium Sustainability
This looks at whether you can hold a higher price than category alternatives without losing volume, and for how long that holds up when a competitor runs a promotion.
👉Customer Acquisition Cost (CAC) Trend
A strengthening brand should, over time, reduce your reliance on paid acquisition, because more people arrive through direct search, word of mouth, and repeat behaviour. A flat or rising CAC despite improving recognition metrics is a warning sign.
👉Category Share
Your revenue or unit share within your specific category, tracked against named competitors.
👉Valuation Multiple at Fundraise or Exit
For founders raising capital or planning an exit, investors increasingly ask for brand equity metrics as part of due diligence.
A brand with strong recall, sentiment, and repeat behaviour usually commands a stronger multiple than one competing purely on price and paid acquisition.
A brand can carry the exact same logo, colour palette, and tagline across every channel and still perform in completely different ways depending on where it's being sold.
Quick commerce is a search-and-scroll experience where shoppers browse product thumbnails and make purchase decisions within seconds.
Brand metrics here need to reflect that speed.
🔷Listing-Page Click-Through Rate (CTR)
What percentage of shoppers who see your product in search results or category listings actually tap through to the product page.
This depends largely on packaging design and thumbnail clarity, as those are the only elements shoppers see before deciding to click.
🔷Dark-Store-Level Reorder Rate
Reorder behaviour tracked at the level of individual dark stores. A brand can show a healthy national reorder rate while badly underperforming in specific cities or store clusters.
This usually points to inconsistent stock availability rather than a branding issue, but a combined scorecard can make it seem like a brand problem.
🔷Search-Term-to-Brand Conversion
When someone searches a generic category term, "electrolyte drink" or "face wash for oily skin", how often your specific brand converts that search into a purchase, versus just an impression.
This tells you whether your brand has built enough in-app equity to win a generic search, or whether you're still dependent on ad placement to get seen at all.
🔷Platform Ad Dependency Ratio
The share of your quick commerce sales coming from paid placements (Blinkit Ads, Zepto's ad platform) versus organic ranking.
A strengthening brand should see this ratio decline over time as organic search and reorder behaviour take over more of the volume.
Kirana stores and modern trade operate differently from online channels, with retailers often deciding whether a product deserves shelf space.
If packaging looks confusing or the product doesn't sell, distributors and retailers are less likely to restock it.
🔷Sell-Through Rate at Distributor Level
What percentage of stock supplied to a distributor actually sells through to retailers within a given cycle, versus sitting in a warehouse.
This is often the first real signal of whether your branding is working in offline retail, well before consumer-facing surveys would catch it.
🔷Facing Count
How many units of your product a retailer chooses to display face-forward, and how that compares to competitors on the same shelf.
Retailers allocate facing space based on what moves, so a rising facing count is a retailer's vote of confidence in your brand, earned through actual sales.
🔷Retailer Reorder Frequency
How often individual kirana stores place repeat orders for your SKU, and how that compares across regions.
A brand with strong recall in urban Bengaluru but weak retailer reorder frequency in tier-2 Karnataka has a distribution and packaging-clarity gap.
🔷MRP and Pack Clarity at a Glance
Kirana transactions happen fast, and a shopper or retailer needs to read your price and pack size instantly, without hunting for it.
Brands that redesign packaging without testing MRP visibility at usual shelf distance often see no movement in sell-through, despite a more "premium" looking pack.
Amazon, Flipkart, and Nykaa operate under platform rules that limit how much brand storytelling you can actually control.
Your own D2C site is the one environment where the full brand experience, content, page design, checkout flow, belongs entirely to you.
🔷Cohort-Based Repeat Purchase Rate (D2C-Owned)
Repeat rate measured within specific acquisition cohorts, customers acquired in a given month, tracked over 90 and 180 days, rather than a blended figure across your entire customer base.
A blended number hides whether newer campaigns are attracting better or worse long-term customers than older ones.
🔷Branded Search Share vs Paid
On your own site, how much of your traffic arrives through people searching your brand name directly, versus traffic you're paying for through ads.
Rising branded, unpaid traffic is one of the clearest signs that brand equity is compounding rather than being rented one campaign at a time.
🔷Marketplace Conversion Rate vs Listing Quality Score
On Amazon and Flipkart, conversion rate needs to be read alongside the platform's own listing quality signals, since these platforms actively suppress poorly optimised listings regardless of brand strength.
A strong brand with a weak listing will still underperform a weaker brand with a fully optimised one.
🔷Cross-Channel Price Consistency
Whether your pricing holds steady across D2C, marketplace, and quick commerce.
Inconsistent pricing across channels erodes the price premium your branding is meant to protect, and shoppers notice fast, especially in categories where price comparison across apps takes seconds.
During the first 90 days, focus on ensuring the rebrand isn't negatively affecting performance. Over the next 6 to 12 months, assess whether it outperforms the previous brand identity.
Before tracking these results, however, make sure the rebrand was fully ready for launch.
At Confetti, we use a Repositioning Readiness Check with clients before a rebrand goes live, essentially a set of readiness metrics:
The same framework applies after launch, just with the metrics shifted from readiness to performance.
If you skipped a readiness check before launch, the 90-day tracking below becomes even more important, because you're more likely to be carrying unresolved transition risk.
The first 90 days are about minimizing risk. A rebrand can temporarily disrupt recognition, so the priority is to ensure it doesn't lead to lost customers or reduced search visibility.
📃Existing Customer Recognition Drop
Run a quick recall or recognition check with your existing customer base within the first month.
A meaningful drop means loyal customers are struggling to find or identify you, at the shelf, in-app, or in their inbox, and that needs fixing fast, not waiting out.
📃Search Volume Dip on The Old Brand Name and Pack
Track whether search volume for your old brand name or old pack cues (if people were searching by colour or visual description) is dropping without a corresponding rise in searches for the new name or identity.
A gap here means demand is leaking rather than transferring.
📃Customer Support Confusion Tickets
A spike in support queries asking "is this the same product," "why does the packaging look different," or "did you change your recipe" is one of the earliest and most honest signals that the transition isn't landing cleanly.
📃Marketplace and Quick Commerce Listing Consistency
Check whether your new identity is live and consistent across every platform, D2C site, Amazon, Flipkart, Blinkit, Zepto, Instamart, within the same window.
A rebrand that's live on your website but not yet updated on quick commerce listings creates exactly the kind of split signal that confuses shoppers.
📃Reorder Rate Among Pre-Rebrand Customers
Watch this closely for any dip against your pre-rebrand baseline. Existing customers reordering at the same rate despite a visual change is a strong early signal that the new identity hasn't broken trust.
📌 Bombay Shaving Company's brand audit found three visual identities being used simultaneously: the original razor-and-wings logo, the newer rebranded logo, and the separate Bombae identity for its women's range.
Without a clear indication of which identity was current, the brand risked confusing consumers and weakening recognition.
This is exactly the kind of issue that early post-rebrand tracking is designed to identify and correct.
Once the transition risk has settled, the question changes from "did we break anything" to "is the new identity actually performing better."
This is where you compare the new identity's numbers against the old one's baseline.
📃Unaided Recall Against the Pre-Rebrand Baseline
By month six, recall should be recovering toward, and ideally exceeding, where it stood before the rebrand.
If it's still below baseline at this point, the new identity likely hasn't earned enough exposure yet, or it isn't distinctive enough to stick.
📃Repeat Purchase Rate, Pre vs Post Cohort Comparison
Compare repeat rates for customers acquired before the rebrand against customers acquired after, isolating for the same time-since-first-purchase window.
This tells you whether the new identity is actually earning stronger loyalty.
📃Price Premium Sustainability Post-Refresh
Check whether the brand can now hold a higher price point than before, particularly if the rebrand included a repositioning toward premium.
If price sensitivity hasn't shifted, the visual upgrade hasn't translated into perceived value.
📃Share of Search and Branded Search Share at 12 Months
By the one-year mark, branded search volume should reflect the new brand name or visual cues clearly, with minimal residual search activity tied to the old identity.
📃Category Share Movement
The clearest long-run proof point. A rebrand that isn't shifting category share against named competitors within a year needs an honest conversation about whether the strategy was right.
Your brand only creates value if it drives results.
While you measure engagement, traffic, and conversions, we at Confetti build the brand identity behind those metrics, helping businesses create stronger recognition, trust, and long-term growth.
✅ We Build "Ownable" Assets that Drive Recognition Metrics: We don't just improve aesthetics. We create distinctive, memorable brand identities that strengthen brand recall and awareness, making it easier for customers to recognize your brand at a glance.
✅ Consistency Across Every Touchpoint to Boost Authority: Brand consistency builds trust. We ensure your website, packaging, social media, and other brand touchpoints maintain a unified visual and verbal identity, strengthening customer trust and long-term loyalty.
✅ Speed-to-Market Without Sacrificing Quality: We use efficient, agile design processes to launch your campaigns faster. This gives you a direct competitive advantage and allows you to test and iterate quickly, directly improving your Time-to-Conversion rates while maintaining premium aesthetics.
✅ Data-Informed Design: We design with strategy, not just aesthetics. By applying user behavior insights and proven design principles, we create visuals and interfaces that encourage action, helping improve click-through rates (CTR) and reduce customer acquisition costs (CPA).
✅ Scalable Systems for Sustainable Growth: Your brand should grow with your business. We create scalable design systems and brand guidelines that keep your identity consistent across products, channels, and markets, supporting long-term customer loyalty and sustainable growth.
Ready to turn your branding metrics into a reality? Get in touch with our branding experts.
Most branding measurement failures happen because brands measure at the wrong time or combine different metrics into a single score, making meaningful insights harder to identify.
Follower counts, impressions, and page views are useful, but they don't show whether branding delivered a business return.
A common example is a rebrand that boosts Instagram engagement by 40% after launch. The increase in likes, comments, and shares is a positive sign because it shows people noticed and responded to the new identity.
However, if repeat purchase rates remain unchanged a few months later, the rebrand hasn't yet influenced customer behaviour.
📌 High engagement with flat repeat purchases usually means the new branding has improved perception, but not buying decisions. In that case, the issue is mostly pricing, product availability, or the customer experience rather than the brand identity itself.
Measuring brand recall or repeat purchases just two weeks after a rebrand reveals very little. Most customers haven't seen the new identity often enough for it to influence recognition or behaviour.
The opposite mistake is measuring only once. A strong benchmark at launch doesn't guarantee long-term success. Brand perception can change as competitors improve, market conditions shift, or the product range expands.
📌 Track brand recognition and sentiment quarterly, and conduct a more comprehensive brand health review every six months. For rebrands, monitor performance more closely during the first 90 days to identify and resolve issues early.
Brands selling through D2C, quick commerce, and offline retail shouldn't rely on a single blended scorecard. Combining channel performance can hide important issues.
For example, a blended repeat purchase rate of 32% may seem healthy. But a closer look might show a 45% repeat rate on D2C and just 18% on quick commerce. The overall number masks a clear performance gap that needs attention.
📌 Track brand metrics by channel instead of combining them. Prioritize the channels that contribute most to your revenue. For brands focused on quick commerce, metrics like listing click-through rate and reorder rate provide far more useful insights than overall averages.
How do you measure branding success?
Branding success is measured across four layers: recognition (do people know you), perception (what they think of you), behavior (do they act differently), and business outcome (does it affect revenue or valuation).
Track at least one metric per layer rather than relying on a single number.
What is a good brand awareness metric to track?
Unaided brand recall, asking customers to name brands in your category without prompting is the strongest awareness metric because it reflects genuine top-of-mind presence.
Unlike aided recall or impressions, which can be inflated by ad spend alone.
What is the difference between a brand metric and a brand KPI?
A metric is any measurable data point about your brand, like sentiment score or reach. A KPI is a metric tied to a specific, time-bound business goal.
For example, "raise unaided recall from 12% to 20% in two quarters." Not every metric needs to be a KPI.
How soon after a rebrand should you measure results?
Check for confusion and recognition drop within the first 90 days, since existing customers need time to adjust.
Wait 6–12 months before judging whether the new identity is actually converting better, since behavior and business metrics move slower than perception.
What brand metrics matter most for D2C and FMCG brands in India?
Beyond standard awareness and sentiment tracking, Indian D2C and FMCG brands should track channel-specific behavior: quick commerce reorder rate, kirana sell-through and shelf facing, and branded search share versus paid.
Since performance varies significantly by channel.
Can branding success be measured without market research tools?
Partially. Behavior and business outcome metrics, repeat purchase rate, branded search share, price premium sustainability, can be tracked through existing analytics and sales data.
Perception and sentiment metrics generally need structured surveys or social listening to measure accurately.
Want strategic branding and packaging like this for your business?





.webp)
.webp)

.webp)
.webp)
.webp)
.webp)
.webp)







.svg)
.webp)