%201.webp)
02
AI Snaps
.svg)
.svg)
01
Our Work

03
About Us
05
Contact Us
06
Client Success

07
Blogs
08
Careers
Book A Call


Need Help In Building Your Brand?
Click the button below & book a call with our founder directly.

Rishabh Jain
Managing Director
invest in design, relative to what you spent on it.
But getting to an accurate number requires knowing which metrics to track, when to track them, and what to attribute to design versus other variables.
This guide helps you understand the kind of gain you can and should expect from packaging design.
Most marketing ROI calculations are campaign-based. You run a campaign, track cost-per-click, conversion rates, and return on ad spend.
Those metrics are clean, contained, and reportable Packaging design ROI doesn't work like that, because:
💡Packaging Works Across Multiple Touchpoints
Unlike a social ad that runs for four weeks, a packaging design is always on.
It is present at retail shelves, e-commerce product thumbnails, doorstep delivery, the moment of first use, and even when a customer reuses or repurposes your box.
Your ROI comes from multiple touchpoints and timelines:
A single campaign ROI number cannot capture all of this. Instead of a single metric, packaging ROI needs to be mapped to each stage of the funnel.
💡Packaging is Capital expenditure with Operational Impact
packaging redesign costs more upfront but generates returns for two, five, sometimes ten years. A well-designed packaging system becomes an appreciating asset.
The longer it runs, the lower the effective cost per unit. Your Google Ads don't get cheaper the longer you run them. Your packaging does.
💡Packaging Has a 100% Open Rate
Your email newsletter gets opened by maybe 20% of subscribers.
Your Instagram post reaches a fraction of followers.
But every single person who buys your product interacts with your packaging. Every. Single. One. That's not a media channel with waste. That's pure, guaranteed attention.
💡Packaging ROI is Much Broader
Return on packaging design includes direct financial offsets that general marketing ROI never touches.
Better structural design reduces dimensional weight, which lowers shipping costs.
Stronger materials reduce damage rates and return rates, which flow directly to margin.
One study found that good packaging can reduce return rates. That's cost avoidance. General marketing ROI calculations don't include freight savings.
💡Packaging Design Builds Brand Equity
Advertising spends against brand awareness. Packaging builds it.
Every interaction reinforces recognition, trust, and perceived quality. That brand equity has measurable financial value.
Packaging design directly impacts brand valuation by influencing perceived quality, consumer trust, pricing power, and repeat purchase behaviour.
Related: Learn how packaging design directly shapes brand valuation
You cannot measure ROI if you have no pre-redesign data to compare against.
This is the most common reason brands can't prove packaging ROI because they didn't document where they started.
Before any design work begins, record the following:
If you're working with retail partners, request category-level sell-through benchmarks before you launch. Those will be the most useful comparison point post-redesign.
Most brands undercount their investment and inflate apparent ROI as a result. Use this framework:
Getting these numbers is very important. A ₹6L design project that requires ₹4L in production changeover is a ₹10L investment, and your ROI calculation needs to reflect that.
💡Tip: Document your baseline in a single dashboard or spreadsheet. Share it with every stakeholder: marketing, operations, finance, sales. When someone asks six months post-launch whether the redesign worked, you point to the baseline. No arguments. No opinions. Just numbers.
Example:
Imagine a skincare brand relaunches with new packaging in October. By December, sales are up 35%. The team celebrates, and attributes the gain to the redesign.
But they never recorded their pre-redesign numbers.
What they didn't account for:
Without a documented baseline: sales velocity, return rate, listing CTR, NPS, there's no way to separate packaging performance from seasonal lift, competitive gaps, or promotional noise.
Now, consider the flip scenario.
The same brand had documented baselines:
Post-redesign (same period, next year, no discount): 560 units/week, 4.1% return rate, 4.8% CTR, NPS of 56.
Same result: but now it's provable + attributable. That's the difference between a gut feeling and a business case for the next investment.
Does Your Brand Show These 12 Packaging Redesign Needed Signs?
Packaging ROI (%) = [(Revenue Lift + Cost Savings + Price Premium Captured) – Total Investment] ÷ Total Investment × 100
Each part needs to be calculated separately, then combined.
1. Direct Revenue Lift
Compare sales volume in the same period (ideally 6 months) before and after the redesign.
Control for seasonality by comparing year-over-year, not just pre/post.
If your category grew 8% overall and your brand grew 22%, you can conservatively attribute the 14-point differential to packaging, after accounting for other changes.
2. Price Premium Captured
Did the redesign allow you to increase price without a proportional volume drop?
Calculate: (New Price – Old Price) × Units Sold post-redesign.
This is especially powerful in premium and gifting categories, where packaging is the primary signal of product value.
3. Damage and Return Reduction
Calculate your return rate before and after redesign, multiply the reduction percentage by your cost per returned unit.
If your return rate dropped from 9% to 5% and you ship 10,000 units per month at an average order value of ₹800, that's ₹3.2L/month in saved cost or ₹38L+ over a year.
4. LTV Improvement
If repeat purchase rate improved post-redesign, this is packaging ROI in its most compounding form.
Calculate: (New Repeat Rate – Old Repeat Rate) × Average Margin × Customers Acquired in Period.
A snack brand spends ₹10L on a full packaging redesign, including design fees, prototyping, and production changeover.
Over the next 6 months:
Approximate net gain (6 months):
ROI = (₹35L – ₹10L) ÷ ₹10L × 100 = 250%
Well-executed strategic packaging redesigns routinely deliver 150–300% ROI within the first 12 months when the brief is tied to commercial objectives from the start.
Here’s how https://confetti.design/blog/how-we-increased-a-clients-revenue-by-12x-in-3-months
You cannot improve what you do not measure.Below are seven metrics worth tracking:
These are directly measurable from sales data, platform analytics, and operational reports:
📊Sales velocity: Units sold per week/month vs. pre-redesign baseline — your most direct measure of shelf performance
📊Sell-through rate: Especially important for seasonal products or retail distribution; a rising sell-through rate often precedes retailer reorder increases
📊Return and damage rate: Track by SKU; even a 2–3% improvement in a high-volume product is significant at scale
📊Average order value (AOV): Premium packaging encourages bundle purchases and trading up. Track this closely for gift and premium categories
📊Retailer reorder rate: Retailers reorder what sells. A shortening reorder cycle is a strong signal of improved shelf conversion
📊E-commerce listing CTR: On Amazon, Blinkit, or your DTC store, your pack is your ad. A rising CTR from the same search position means your redesign is working
📊Dimensional weight efficiency: Measure your package's dimensional weight (DIM weight) versus actual weight. Carriers charge by whichever is higher. A redesign that shaves 1 inch off each dimension can cut shipping costs by 15–25%.
These take more effort to collect but reveal the brand equity gains that take longest to show up in sales:
📊Brand perception scores: Survey a panel of target consumers pre and post-redesign. Ask them to rate the product on quality, trustworthiness, and premium-ness, on a 1–10 scale
📊Unboxing UGC rate: Count tagged posts, reels, and reviews explicitly mentioning the packaging or unboxing experience. Track monthly volume and sentiment
📊NPS movement: Packaging experience directly influences post-purchase satisfaction. If NPS is rising without changes to the product itself, packaging is doing work
📊Retail buyer feedback: Are stockists giving your product better shelf placement? Mentioning the new look? These are real signals, document them.
Brand equity is the hardest thing to quantify in the short term. But it's the most durable form of packaging ROI.
McKinsey research across consumer companies found that consistent, distinctive visual identity, including packaging, can increase revenue by 10–20% over a 3–5 year period. Consumers who recognise your brand from packaging alone buy faster, trial new products with less hesitation, and are more resistant to competitive switching.
This is why packaging design investment is categorically different from a paid media spend. The ad disappears when the budget stops. The packaging stays on the shelf, in the home, and in the consumer's memory.
📊Shelf standout time (seconds):
How long does a shopper pause on your package versus competitors? Measure through in-store observation or remote eye-tracking tools like Tobii or RealEyes. Baseline before redesign.
Target a 50–100% increase. A package that stops the eye for two seconds cannot compete with one that holds attention for six seconds.
📊First-choice preference:
Run a simple A/B shelf test with 100–200 target consumers. Show them your old package and new package alongside competitors.
Ask: "Which would you pick first?" The percentage choosing yours is your first-choice preference. A successful redesign moves this needle by 15 points or more. We have seen lifts from 12% to 38% on a single redesign.
📊Time to find:
This is fairly easy. Place your product on a crowded shelf image. Give test subjects a shopping list. Measure how many seconds until they locate your brand.
Faster discovery correlates directly with higher purchase probability. Average time to find across CPG categories is 5–7 seconds. Get yours under 4 seconds.
📊Unboxing experience score (UES)
Not a standard metric, but build one. Survey customers 48 hours after delivery. Ask three questions on a 1–10 scale: ease of opening, visual delight, perceived quality of packaging.
Average the three. Track UES against repeat purchase rate. A 2-point UES increase typically drives 10–15% higher repurchase.
How we build brand equity through design systems
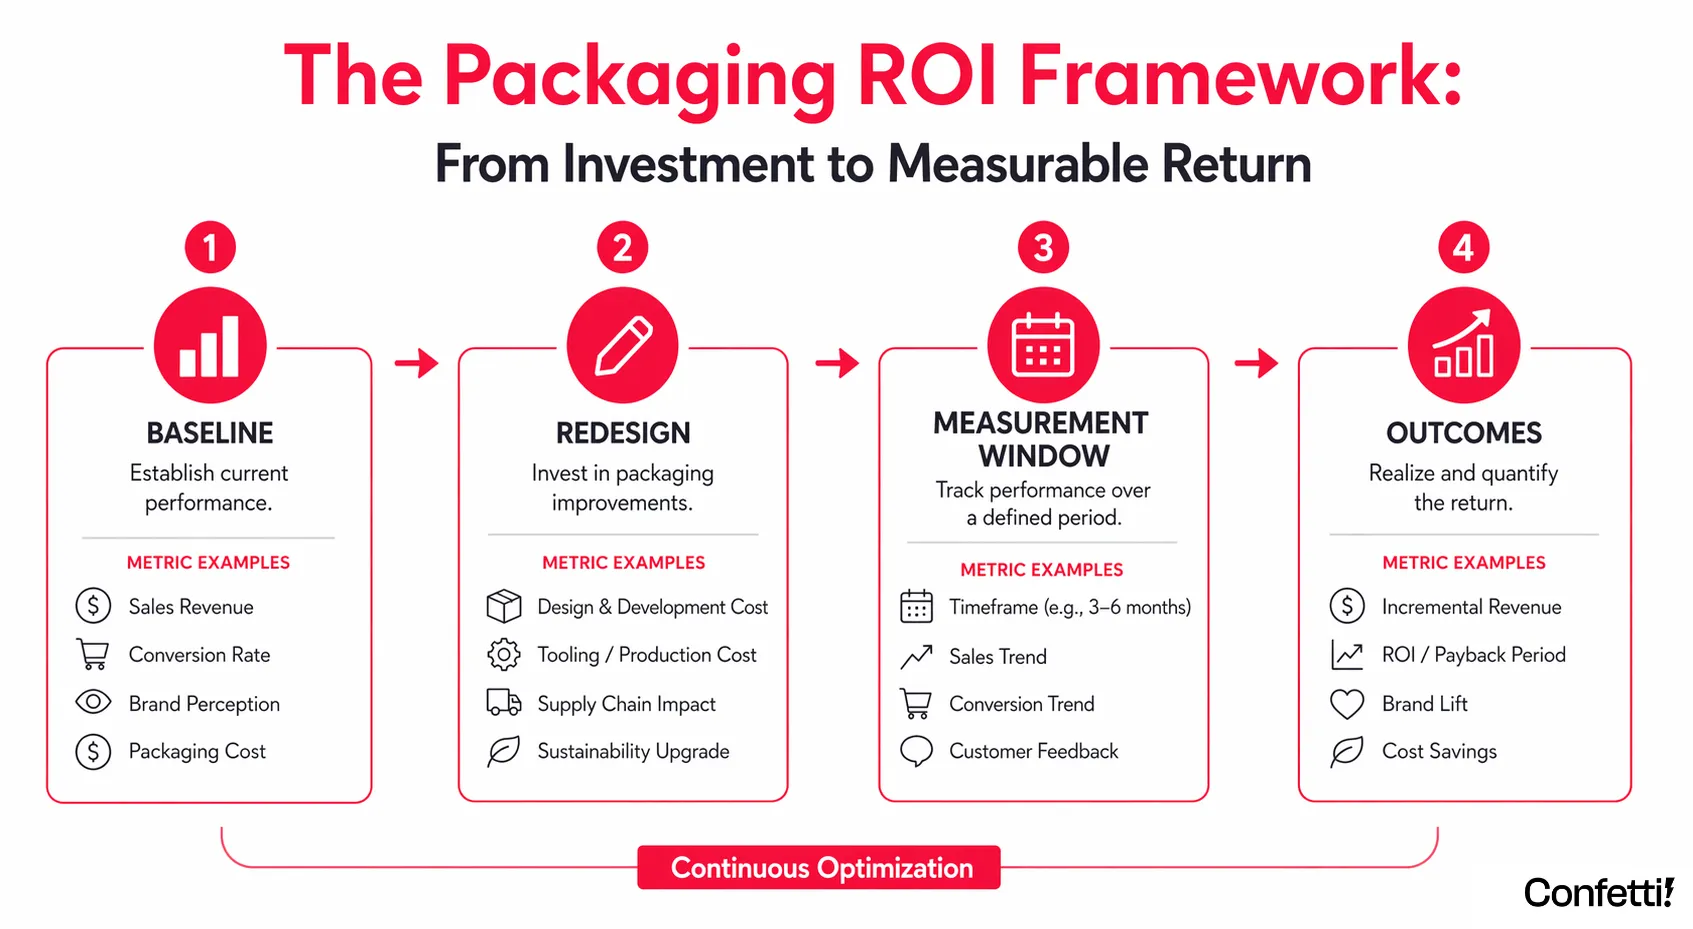
Metrics means nothing without disciplined execution. Here’s how to do it properly, from pre-launch setup through long-term measurement:
Start 4 weeks before launch by pulling all baseline metrics into a single dashboard (Google Sheets, Excel, or Looker).
Include sales, conversion rates, return rates, shipping costs, and any relevant brand metrics.
At the same time, define your measurement window. You need a minimum of 3–6 months post-launch to reach a stable baseline.
The first 4–6 weeks are often inflated by novelty, new customers trial the product, and existing customers may repurchase faster. That early spike is not sustainable performance.
If your category is seasonal, compare like-for-like periods year-over-year, not just before vs. after launch.
For example, a Q4-heavy product should compare October–December performance to the same period last year, not to the months immediately preceding launch.
On launch day, introduce the new packaging as a single controlled change. Do not simultaneously alter pricing, promotions, or distribution.
If changes are unavoidable, document them clearly. This is because every additional variable weakens your ability to attribute results to packaging.
Set a 30-day no-touch window immediately post-launch. Avoid tweaking ad spend, running promotions, or making adjustments. Let the packaging perform in isolation while you collect clean data.
If feasible, run controlled comparisons between old and new packaging. This could be across:
A/B testing removes much of the attribution ambiguity by comparing performance under near-identical conditions.
You can also test individual elements:
Even limited tests (6–8 weeks) can provide high-confidence directional insights.
Track performance across each channel separately: DTC, retail, marketplaces, and wholesale. Packaging changes often impact channels differently.
For example, a redesign might improve e-commerce CTR but have minimal retail impact.
Daily tracking ensures you don’t miss short-term patterns and gives you granular data for later analysis.
Sales data tells you what happened. Consumer research tells you why.
Run short post-purchase surveys at week 1 and week 4, targeting 100–200 customers each time. Keep it simple: 3 to 5 questions:
From this, calculate an attribution factor. For example:
This bridges perception and performance, turning raw sales lift into explainable ROI.
At days 30, 60, 90, and 120, calculate incremental revenue using:
(Post-launch revenue – Baseline projected revenue) × Attribution factor
Your baseline projection should be based on the same period last year, adjusted for market growth. This isn’t perfect—but it’s defensible and transparent.
By month 3, operational data stabilises enough to include cost-side gains:
Pull actual invoices and warehouse data. These savings are often overlooked but can materially improve ROI.
Packaging doesn’t drives conversions and influences every stage of the customer journey:
Track at least one metric per stage. If you only measure conversion, you miss most of the value packaging creates.
Wait at least six months before calculating full ROI. The first 90 days include launch spikes and operational noise. By month six, performance stabilises.
Use a comprehensive formula that includes:
Twelve-month data will give you the most accurate long-term view.
Present your methodology and results to finance:
Once finance validates the numbers, your ROI becomes a business fact.
Then build a rolling tracker, updating quarterly for up to two years. Packaging impact often compounds over time as familiarity and brand recognition grow.
Calculating packaging ROI is tricky and you can easily make mistakes. These are some of the most common mistakes we see brands make:
⚠️Measuring too soon: First-month sales data after a relaunch is almost always inflated. Novelty drives trial. Wait for a stable 3–6 month window before drawing conclusions.
⚠️Counting all post-launch sales lift as packaging-driven: A new package launches. Sales jump 20%. Marketing claims victory. But did a competitor raise prices? Retailer increase facings? Seasonality shift? Without controlling for external variables, your attribution is fiction. Use a control SKU or a control region. Compare against category growth, not absolute numbers.
⚠️Ignoring category context: If your category grew 18% and your brand grew 20%, that 2-point differential is not packaging ROI. Separate your performance from the market tailwind before attributing gains to design.
⚠️Attributing everything to packaging: A redesign that launched simultaneously with a new campaign, a price drop, or expanded distribution will show blended results. Isolate the variables or acknowledge the blended attribution and weight accordingly.
⚠️Skipping qualitative data: Brands that track only hard numbers miss brand equity gains that won't show in revenue for 12–18 months but represent the most durable form of ROI.
⚠️Not accounting for operational savings: Damage reduction, material efficiency, lighter weight formats reducing shipping costs. These are real financial returns that never appear in revenue reports. Build them into your ROI calculation explicitly.
⚠️No pre-redesign baseline: If you didn't document performance before the new packaging launched, you have no comparison point. Every future analysis is guesswork. This is the single most common and costly oversight.
Let’s take a look at some industry benchmarks drawn from Nielsen IQ, McKinsey, and Packaging Digest research.
Remember, these can be used as directional references. The results vary significantly by category, execution quality, and market conditions.
What it Means for Brands
We've worked across FMCG, personal care, food and beverage, and D2C categories, and one thing is consistent:
The packaging projects that generate the strongest ROI are the ones where commercial objectives are defined before the design brief is written.
We don't start with aesthetics. We start with the question: what does success look like for this brand in 12 months, and how does packaging need to perform to get there?
Our process ties every design decision back to a commercial or brand outcome:
Three things separate our approach from typical packaging agencies.
First, we integrate brand strategy into packaging from day one. Packaging is not a standalone deliverable. It is the physical expression of your brand strategy.
We start with brand positioning, audience insight, and competitive mapping before we design anything. This ensures every packaging decision reinforces your brand equity.
Second, we design for the entire customer journey, not just the shelf. Unboxing experience is not an afterthought.
We design the reveal, the sequencing, the tactile interaction, and the social shareability. We have seen unboxing lift UGC by over 300% for some clients. That is free marketing.
Third, we guarantee legal safety and original ownership. All concepts, artwork, and final files are original and fully owned by you. No IP risk. No legal exposure.
Your packaging is secure and future-proof.
We have delivered measurable ROI across categories. Food and beverage. Personal care. Health and wellness. D2C. Our process has been refined through over 200 projects delivered successfully.
Every client receives a clear ROI projection before we start. Every client receives post-launch measurement reports. Every client knows, with confidence, whether their packaging investment paid off.
How do you calculate packaging design ROI?
Use the formula: (Net Gain from Packaging – Cost of Packaging Investment) ÷ Cost of Packaging Investment × 100. Net gain includes sales revenue lift, price premium captured, and cost savings from damage reduction or material efficiency. Track over a minimum 3–6 month window post-launch for a stable result.
What metrics should I track to measure packaging ROI?
Track both hard metrics: sales velocity, sell-through rate, return rate, AOV, and e-commerce listing CTR, and soft metrics like brand perception scores, NPS, and unboxing UGC rates. Together, these give you a complete picture of packaging performance across the purchase funnel.
How long does it take to see ROI from a packaging redesign?
For most FMCG and consumer brands, meaningful ROI signals appear within 3–6 months. Repositioning plays or sustainable packaging transitions may take 12–18 months. Measuring too early like in the first 4–6 weeks, often inflates results due to novelty effects.
Is unboxing experience part of packaging ROI?
Absolutely. Unboxing experience drives post-purchase UGC, referrals, and repeat purchases: all revenue-generating outcomes. E-commerce brands that invest in premium unboxing typically see 2–3x higher review rates and measurable improvements in repeat purchase frequency and LTV.
How do I measure packaging ROI for e-commerce vs. retail?
For e-commerce: track listing CTR, return rate, review sentiment, and repeat purchase rate. For retail: focus on sell-through rate, retailer reorder frequency, and shelf conversion via retail audit data. E-commerce gives you more granular data; retail requires retailer partnerships or field audit tools.
Want strategic branding and packaging like this for your business?


.webp)
.webp)

.webp)
.webp)
.webp)
.webp)
.webp)


.svg)
.webp)
.svg)
.webp)