%201.webp)
02
AI Snaps
.svg)
.svg)
01
Our Work
03
About Us
04
Brand Audit
05
Contact Us
06
Client Success
12
07
Blogs
08
Careers
Book A Call
.svg)



.svg)
Need Help In Building Your Brand?
Click the button below & book a call with our founder directly.

Rishabh Jain
Managing Director
Brand strategy for quick commerce India requires a different discipline entirely. This Confetti guide covers the key decisions impacting quick commerce after launch.
Here’s how to get SKU strategy, pricing and pack size, packaging as performance media, advertising, availability, data, and omnichannel positioning right for your brand.

Quick commerce in India demands a fundamental reframe of how you think about brand building. The frameworks that work for D2C websites, Amazon, or modern trade don't transfer here.
Quick commerce operates on a different consumer psychology, a different algorithmic logic, and a different timeline for brand exposure.
Quick commerce runs on habit and impulse.
On a D2C website, brands earn attention through content, storytelling, and organic search. On Amazon, they fight for keyword rank and review count. In modern trade, they pay for shelf position and in-store display.
On Blinkit and Zepto, the shopper has a need right now. They open the app to solve a problem in the next 10 minutes. A usual scroll through a category page lasts under 10 seconds.
The decision on any single product is made in seconds, based on the thumbnail, the price, and if the shopper already knows you: a fraction-of-a-second recognition cue.
Everything you'd normally build over months through founder content, influencer partnerships, and social proof has to fit into a 200x200 pixel image before any other signal reaches the shopper.
📌All of it, in one thumbnail, in under 3 seconds.
Every brand decision on Blinkit, Zepto, and Instamart eventually runs through the same mechanism: real-time sales velocity per dark store, per geography.
Sell more in a store, and the algorithm shows you to more shoppers in that store's radius. Get shown more, and you sell more.
📌It's a flywheel and once it's turning, it's one of the most efficient growth mechanisms available to a brand in India today.
But it doesn't start turning on its own. The initial conditions have to be right:
It acts like a sequence:
Paid visibility creates the first sales data → algorithm reads that data and starts surfacing you organically → organic and paid impressions combine → velocity builds → repeat purchases and reviews reinforce the signal → paid spend as a percentage of revenue starts dropping.
📌From SKU selection to advertising spend to availability, should be judged against one question: does this get the flywheel turning faster, or does it slow it down?
That's the test we'll apply, decision by decision.
A dark store holds roughly 8,000–10,000 SKUs in 2,000–3,000 square feet. Every category has a fixed, small number of slots, the ones a shopper actually sees when scrolling.
If you list 20 SKUs and you're splitting your inventory, your ad budget, and your algorithmic signal 20 ways, and building real velocity on none of them.
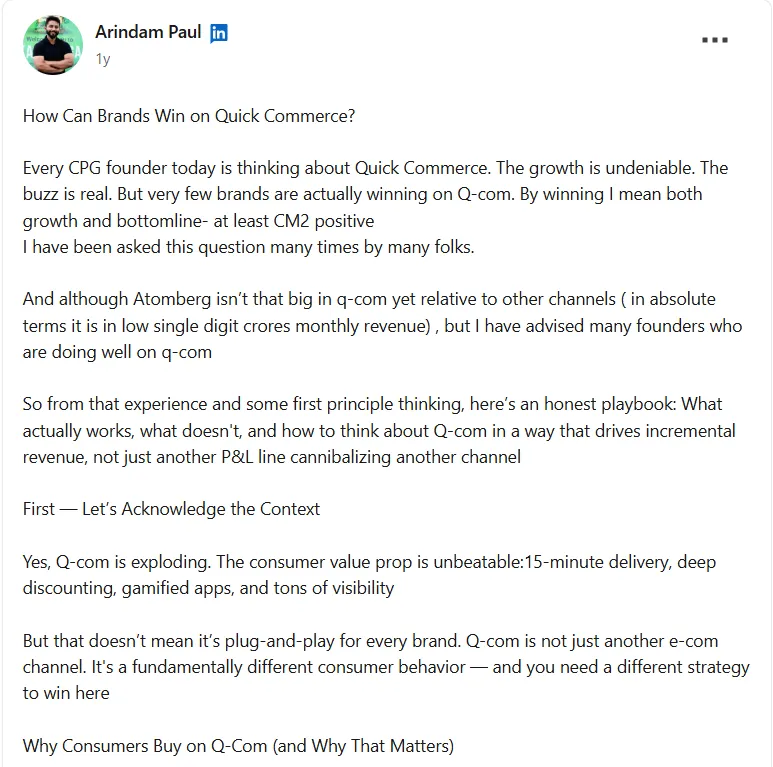
Atomberg's experience makes the case well. The founding member has described how the platforms kept pushing for a wider assortment, and Atomberg did the opposite. They found their 2–3 highest-velocity SKUs per geography and put everything behind those instead.
Win on velocity, and the algorithm rewards you with visibility. Win visibility, and velocity compounds further. The flywheel only starts turning when a brand concentrates.
📌A brand with one SKU in the top 3 organic positions of its sub-category will outsell a brand with 15 SKUs scattered across positions 8 to 15, every time.
Select SKUs for Q-commerce against these criteria simultaneously:
1. Instant-use Alignment
❓Does the product fit a consumer's immediate need state
The strongest Q-commerce SKUs align with recognisable need-now moments: hunger, a run-out emergency, an impulse indulgence, immediate replenishment.
A 250g butter pack fits the "I'm baking today and just realized I'm out" moment. A 1 kg catering block of butter doesn't, it's too much quantity and too expensive for an immediate need.
Your Q-commerce atta SKU should be 100g or 250g.
2. Velocity Potential
❓How many units per SKU per dark store per day is realistic
SKUs that sell 5+ units per dark store per day build algorithm signals. SKUs that sell 0.5 units per dark store per day are invisible.
Before listing, estimate category demand in your target geography and your realistic market share within it. If that number doesn't reach 3–5 units per dark store per day, the product may not be a Q-commerce SKU at its current price point or format.
3. Margin Viability
❓After full platform cost stack: commission (15–25%), GST on commission, logistics, advertising, write-offs, does the SKU generate a positive contribution margin?
Calculate this before listing. SKUs with margins below 50% gross often can't support Q-commerce economics.
Your retail pack size and your quick commerce pack size shouldn't automatically be the same product.
The average Blinkit or Zepto order runs ₹350–₹700. That basket usually holds groceries, daily essentials, or other small impulse adds alongside your product.
Which means the price psychology at play here looks a lot more like kirana-store economics than modern trade.
Shoppers carry strong mental anchors at ₹49, ₹99, ₹149, ₹199, and ₹299 for most FMCG and personal care categories, and pricing around those anchors changes conversion in ways that have nothing to do with the actual cost difference.
A product at ₹199 will convert faster than the identical product at ₹210, because ₹199 is under the ₹200 threshold in the shopper's head.
A 5kg commodity pack that makes complete sense in a monthly supermarket run doesn't work as a 9pm impulse add on Blinkit, no matter how good the per-kg price is.
Pricing that ignores category-level mental anchors like ₹49 or ₹99 struggles to convert and that holds even for premium brands who assume their positioning exempts them from the anchor.
Premium brands still have to solve for the thumbnail-and-price-tag decision made in under 3 seconds, same as everyone else on the category page.
The right-sizing principle: Your Q-commerce pack should be sized for the "right now" use case. The consumer is buying for tonight, or for the next few days.
A pack that fits a single use occasion or a 3–7 day supply usually outperforms a pack sized for monthly household economics.
Practical pack size guidelines by category:
The bundle as a conversion lever:
A combo pack of two 100g snack packs priced at ₹199 will usually convert better than a single 200g pack at ₹179. Because the bundle communicates value (two items) even though the price per gram is identical.
📌Bundle strategy on Q-commerce deserves specific attention during the initial 90-day period when conversion rate data is available at the SKU level for the first time.
The platform cost runs 35–50% of MRP :: commission, logistics, ads, write-offs.
That pressure pushes brands toward one of two moves: raise MRP for the channel, or lean into heavy platform discounting to force velocity.
Both damage brand equity if you're not careful.
Raise MRP on Q-commerce while holding a lower price elsewhere, and category managers notice, and so do consumers who cross-check. That's a pricing integrity problem.
Lean into aggressive discounting instead, and you train your Q-commerce buyer to wait for the markdown, every full-price listing after that undersells itself.
The sustainable route is a Q-commerce-specific SKU, a different pack size or format that doesn't create a direct price comparison across channels, rather than the same product at two different prices.
📌A 150ml Q-commerce-exclusive face wash at ₹199 doesn't compete against your 200ml retail pack at ₹249, because in the shopper's frame of reference, they're not the same product to compare.
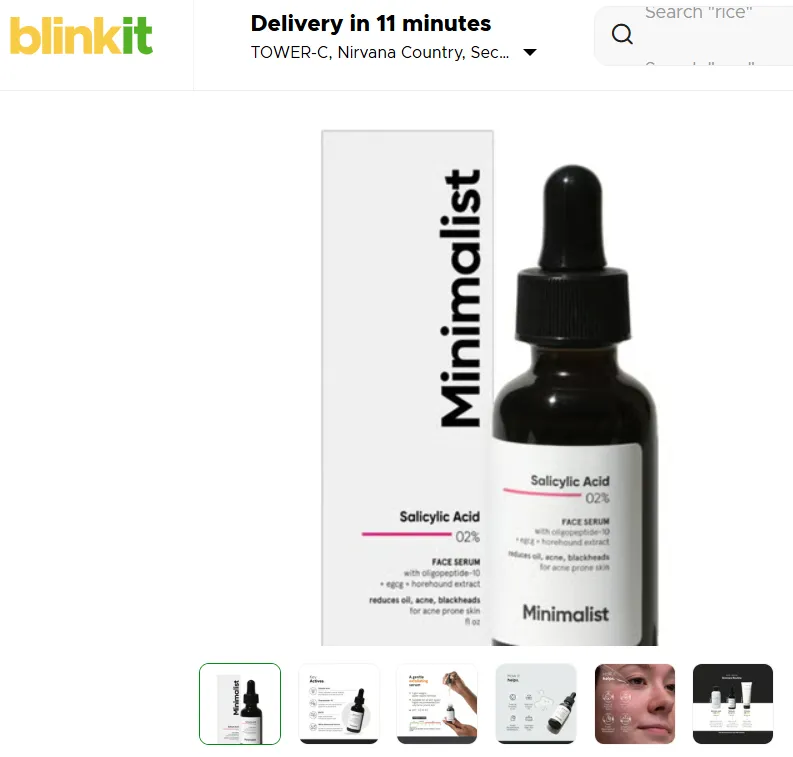
On Blinkit, your product shows up as a thumbnail next to 10–20 competitor SKUs on the same category page. The shopper is scanning.
In that environment, packaging is the sale. It's the only thing standing between your product and the next thumbnail in the moment a shopper decides.
Most brands design packaging for the retail shelf or for an Instagram flat-lay, shoot it for launch, and then upload those same photographs to the Q-commerce catalogue.
It looks beautiful at A4 size but shrunk to 200x200 pixels,competing against 15 other thumbnails.
So, at Confetti,we approach this from the brief stage while designing a packaging for quick commerce to make your brand stand out in a specific category.
Screen-first is a specific set of design decisions about what survives compression to thumbnail scale.
🟣Brand Name Legibility
A brand name set in a 10pt decorative serif is unreadable on a 5 inch mobile screen. It needs a bold, clean typeface, weighted and sized to hold up under compression.
Test every logo lockup at 100px width before you approve any Q-commerce product photography.
🟣Variant Callout Readability
If you sell mango, guava, and orange, the variant name is the 2nd most important element on the pack after your brand name, at thumbnail scale.
On a shelf, a shopper can pick the pack up and read the fine print. On Q-commerce, if the variant isn't legible in the thumbnail, they pick a competitor whose variant is.
🟣Colour Contrast for Category Differentiation
Scroll the snacks category on Blinkit and count how many packs are yellow, red, or orange, most of them.
A brand that breaks that pattern with deep teal, electric blue, or black earns a visual scan advantage before the shopper even registers the name. In personal care, where most packs are in white and pastel, a high-contrast label does the same job.
🟣Minimal Front-Face Hierarchy
Retail packaging often carries 6+ elements on the front: brand name, product name, variant, key claim, certification badges, weight, regulatory marks. At a small thumbnail, that's noise.
Strip it down to 3 things:
Nothing else competes for attention.
📌Minimalist's skincare packs are a go: ingredient-forward labels, high contrast, large legible type on white backgrounds.
Click-through rate (CTR) on a Q-commerce category page is an algorithmic ranking signal.
Products with a higher CTR at the same search position climb organic rank over time.
A 5% CTR lift from a more legible thumbnail compounds into meaningfully higher organic visibility over 8–10 weeks, without spending another rupee on ads.
Most brands don't track CTR as a brand health metric here. They watch orders and GMV and stop there.
But CTR is the exact moment your visual identity either earns the click or doesn't. The most direct read you'll get on whether your packaging is doing its job on this channel.
Brands that A/B test their thumbnails, different label layouts, dominant colours, variant callout sizes, using CTR data from Blinkit's Seller Hub or Zepto's Jarvis console are the ones treating this as strategy rather than compliance.
📌The most durable quick commerce performance aces the thumbnail before packaging approval.
At Confetti, we focus on addressing the important question, "Does this earn the click on mobile phone, next to competitors, on a phone screen at 9pm.".
Advertising spend across Blinkit, Zepto, and Instamart is projected to reach ₹4,900 crore by 2026.
The share of voice has become the variable that decides who gets seen. Purchase decisions on these platforms compress into the first few rows of search results. A brand outside those rows is commercially invisible, no matter how good the product actually is.
Advertising on Q-commerce is the cost of access to the consumer at the exact moment they intend to buy. Budget for it the way you'd budget for modern trade slotting fees.
The point of paid placement is to buy the initial velocity that earns you organic placement on quick commerce, then step spend down as the algorithm starts doing the work for free.
🗓️Days 1–30: 100% Paid
No sales history exists yet, so no organic impressions exist either.
Put your full ad budget behind 3–5 hero SKUs, on the top 3–5 most relevant search keywords per product, in the exact geographies where your dark store inventory are.
🗓️Days 31–60: Mixed
If velocity built adequately in month one, organic impressions start showing up in your seller dashboard.
Hold paid spend steady and watch organic impression share week over week. Growth here means the algorithm is responding to you.
🗓️Days 61–90: Evaluate
Once organic impressions cross roughly 20% of total impressions, start pulling back on the lower-intent placements, banners, push notifications. While keeping search ad investment intact.
If organic is still flat at this point, don't cut paid spend blind. Diagnose first: is it a velocity problem, a CTR problem traceable to packaging, or category saturation? Each has a different fix.
₹ Budget scales with how contested your category is:
The Q-commerce algorithm reacts to sales velocity. It doesn't care where the demand originated.
A purchase driven by a Meta ad that sent someone straight to Blinkit counts exactly the same as one from a Blinkit sponsored search placement. The algorithm tracks orders.
That's a real opening for any brand with an engaged social following, active influencer relationships, or the ability to run geo-targeted Meta or Google campaigns.
You can generate velocity on Q-commerce without spending a rupee on the platform's own ad tools.
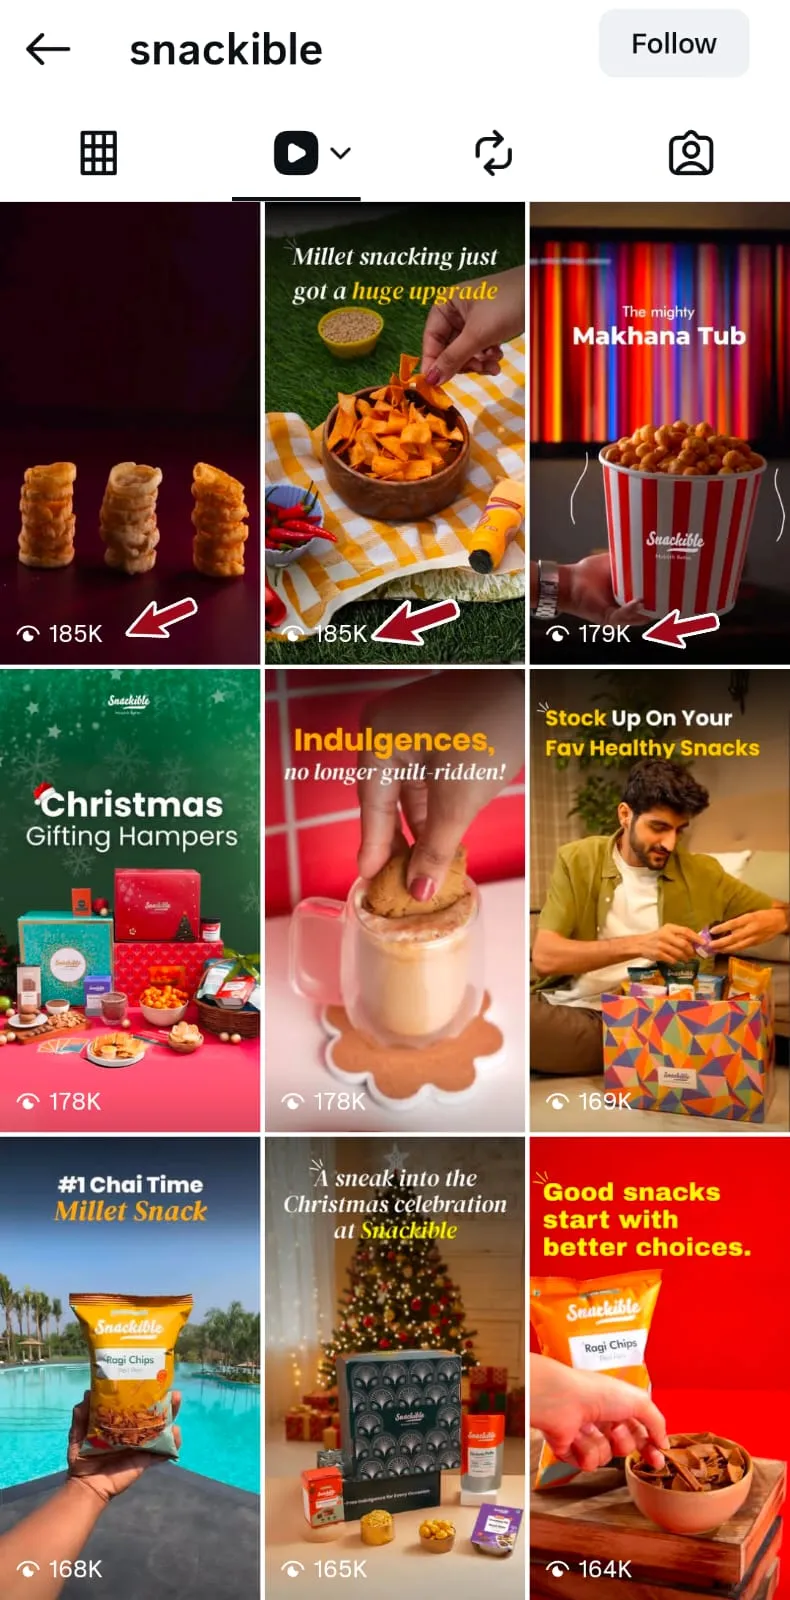
✔️Post Reels or Stories that name the brand and the platform directly ("Order on Blinkit: 10-minute delivery")
✔️Link straight to the listing in Stories
✔️Run Meta campaigns geo-targeted to the exact pin codes your dark store inventory covers
Orders climb. The algorithm notices the velocity spike. Organic ranking follows.
📌For example, a snack brand with a good social media presence can redirect their audience to Quick commerce platforms.
In modern trade, running out of stock costs you a sale. In Q-commerce, it costs you a great deal more than that. It's an algorithmic event with consequences that outlast the stockout itself.
The moment your product shows "unavailable" in a dark store zone, the algorithm logs it as an availability failure and suppresses your ranking in that zone.
🕐Restocking doesn't fix this instantly. The algorithm usually takes 1–2 weeks to rebuild confidence in your reliability.
Through that recovery window, you're losing organic visibility and the algorithmic momentum you'd already built, on top of whatever sales you missed during the stockout itself.
Platforms benchmark performance against a 95–98% fill rate. Brands that hold that line consistently build platform trust scores that shape how the algorithm treats every SKU they list.
Brands that don't, get pulled into a downward spiral.
⚠️Low availability leads to low ranking, leading to low sales, the algorithm starts treating the product as low-priority, and that lower priority translates into lower restocking frequency. Which produces even lower availability.
Once that cycle starts, it's genuinely hard to break without a deliberate supply-side fix.
On Q-commerce, it's one of the highest-leverage strategic decisions you'll make, and it comes down to three choices.
🟣Replenishment Frequency
Fast-moving categories on quick commerce: snacks, beverages, personal care basics, need dark store replenishment 2–3 times a week in high-velocity locations. A weekly cycle will produce stockout windows in exactly the dark stores where you're winning.
Fixing this means more warehouse locations, more flexible logistics partners, or carrying buffer stock in your own infrastructure, whichever your scale supports.
🟣Buffer Stock Planning
A viral reel, an influencer feature, a festive weekend, or even a sudden weather shift can drain a dark store's inventory within hours. A brand carrying 3–4 weeks of buffer stock per city rides those spikes out.
A brand carrying 10 days doesn't, and every spike becomes a missed opportunity plus an algorithmic penalty.
🟣Geographic Inventory Allocation
Demand on Q-commerce is hyperlocal. Your product moves differently in South Mumbai than it does in Andheri, even within the same city. Brands that allocate stock based on city-level averages routinely over-stock some dark stores and starve others.
So, use Blinkit's Seller Hub or Zepto's Jarvis console to see which dark stores are actually generating velocity per category. Allocate inventory to match that signal.
The brands building genuinely durable businesses on Q-commerce treat performance data as the most important consumer behaviour database they've ever had access to.
No previous retail channel in India has delivered this combination: real-time, SKU-level, geography-level, time-of-day-level purchase data, reconciled against advertising spend, down to pin-code precision.
A few questions this data can answer directly:
❓Which flavour variant actually wins when consumers self-select, with no promotion pushing them toward it
Compare organic velocity by variant, controlling for ad spend, and you get an honest read on preference.
❓Which city shows the strongest 30-day repeat purchase rate for your category
That's your most price-inelastic, brand-loyal market. It's also where your next modern trade expansion should go first.
❓What time of day does your product peak
A brand spiking at 9pm is an impulse or snacking brand. One peaking at 8am is a morning-routine brand. That single data point should be shaping your marketing creative and your social posting schedule.
❓Which pack size earns the highest repeat rate
That's your real customer acquisition SKU.
Quick commerce is a channel within a brand strategy and it plays a specific, limited role in the broader consumer relationship. If you treat it as the whole strategy, you'll face problems:
⚠️Over-Dependence
Pulling 70–80% of revenue from Q-commerce with no parallel channel development. Which leaves you exposed the moment a platform changes its algorithm or commission structure.
⚠️Under-Commitment
Treating quick commerce as a side experiment without the operational and marketing investment that actually builds velocity, and then concluding the channel "doesn't work" for your brand.
📋1. Trial and Acquisition Engine
The impulse mechanic and hyperlocal availability make Q-commerce the fastest trial-generation channel in Indian retail for high-frequency categories. Someone who's never bought your product sees it in a Blinkit search result and adds it on impulse.
Cost of acquisition is usually ₹80–₹150 with optimised advertising. That trial leads to a review, which feeds the algorithm, which drives more organic trials.
If you're building a trial, entering a new geography, launching a new variant, fighting for share against an established player, this is the fastest lane available to you.
📋2. Repeat Purchase and Revenue Engine
For daily-replenishment or high-frequency categories: face wash, protein bars, energy drinks, baby care, the speed and habit mechanics of Q-commerce make it a genuine repeat-purchase driver.
Three or more reorders on Blinkit, and the purchase becomes habitual, faster than it would on any other channel, because the friction to repurchase is close to zero.
A Q-commerce habitual buyer carries meaningfully higher Lifetime Value(LTV) than a D2C buyer facing 2–3 day delivery and checkout friction. If this is the role you're assigning the channel, track 30-day and 90-day reorder rates as your primary success metric.
📋3. Geographic Expansion Tool
Adding a second or third city on Q-commerce requires APOB GST registration, inventory dispatch, and an extended ad budget.
It doesn't require a distributor appointment, a field sales hire, or months of relationship-building. Once you've proven the product in one city, this is the fastest way to extend the footprint you have access to.
📋4. Modern Trade Negotiation Lever
Documented Q-commerce velocity data is increasingly showing up in D2C brands' modern trade negotiations. A brand that can point to 500 monthly orders across South Mumbai's Blinkit dark stores has an independently verifiable demand signal.
A DMart or Reliance Smart category buyer can check themselves. It's becoming the new proof of demand, replacing the old requirement of a distributor track record.
Cross 50% of revenue from Q-commerce and you're carrying real concentration risk.
3 channels worth building in parallel while Q-commerce scales:
📌Brands holding Q-commerce at roughly 30–40% of revenue, with the rest spread across D2C, marketplaces, and offline, have a resilient commercial structure.
Brands at 70–80% concentration are one platform policy change away from a revenue crisis they didn't see coming.
.webp)
We design packaging, visual identity, and catalogue assets specifically for the quick commerce environment with the thumbnail test built into every approval stage.
That means:
✅Every front-of-pack design is tested at on a mobile screen before it's approved:
It is Benchmarked against the top 5 organic competitor listings in the same category on Blinkit and Zepto. If the brand name, product type, variant, and key claim aren't legible in under 2 seconds, the design goes back for another pass.
✅Label hierarchy is built for the thumbnail environment:
Bold typeface weights, high-contrast dominant colour blocking, a single front-face claim instead of six. And a variant callout that's the second-most-visible element on the pack after the brand name.
✅NPI-ready catalogue assets are built to each platform's format specifications simultaneously:
Front, back, and lifestyle images for Blinkit, Zepto, and Instamart together, so the first NPI submission goes through clean and the go-live timeline doesn't stretch out over correction cycles.
✅Existing packaging gets audited against dark store operational requirements:
Barcode placement for shelf-scanning, FSSAI number position on the primary pack rather than buried on the outer carton, MRP visibility for inward inspection, and structural durability that survives pick-and-pack handling rather than just a studio shoot.
We've worked across the scale spectrum on this from ITC B Natural at the large FMCG end to early-stage D2C brands entering quick commerce for the first time.
The brief doesn't change with size: make the product win on screen, survive the dark store, and earn the repeat.
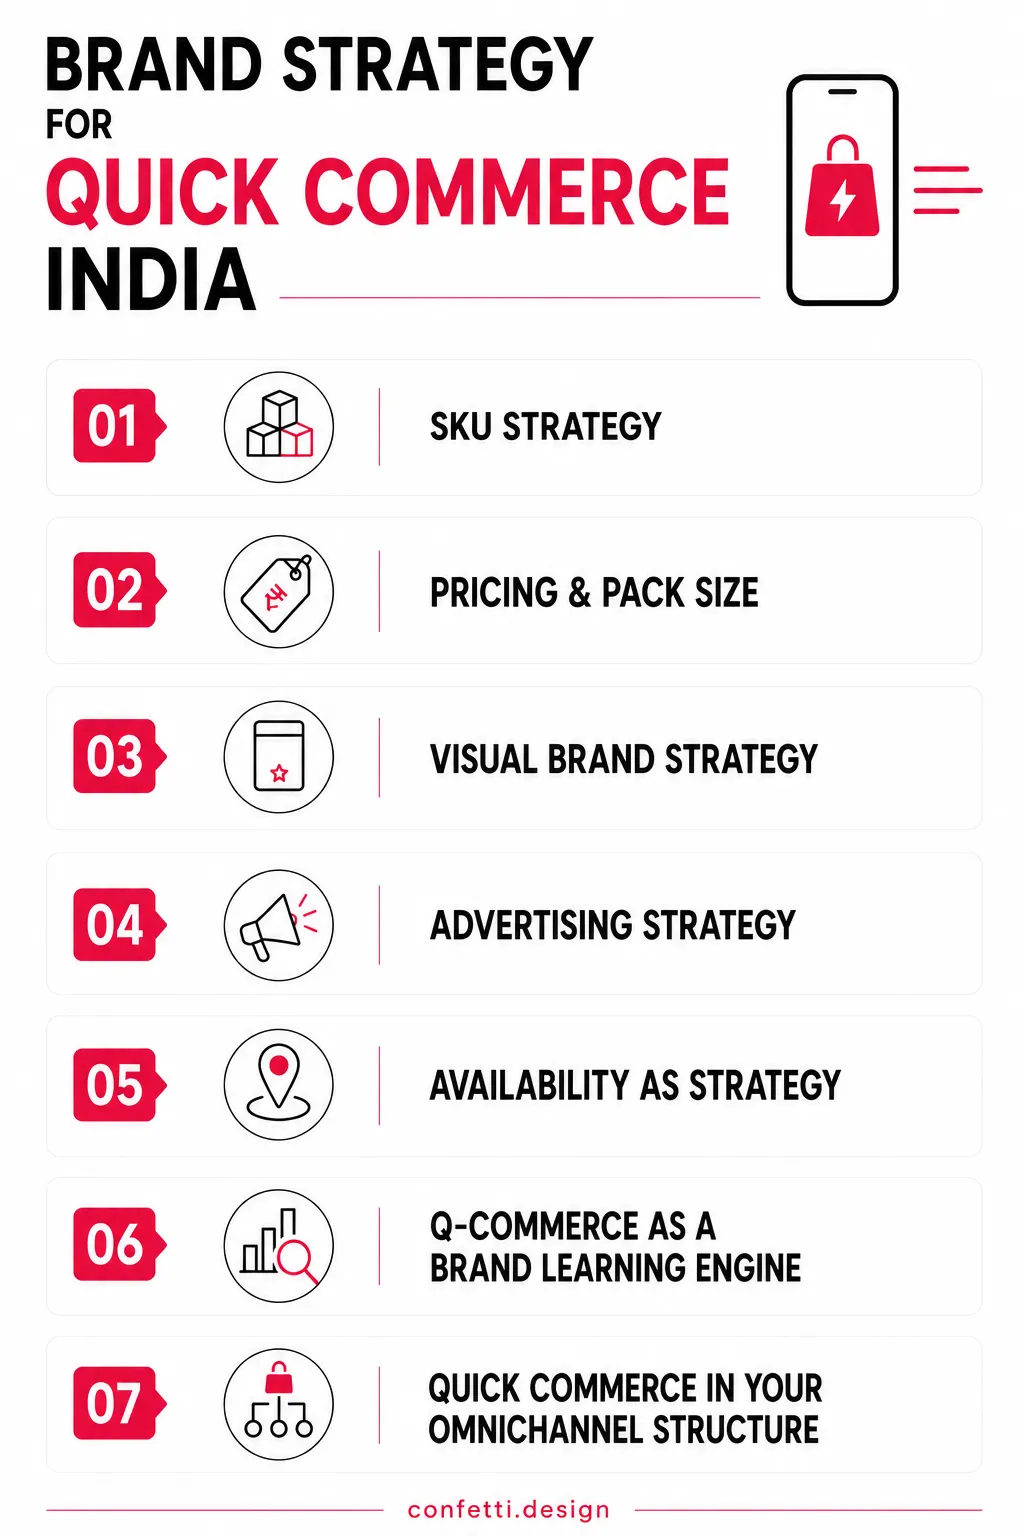
Brand strategy for quick commerce in India comes down to seven interconnected decisions.
What is the most important element of a brand strategy for quick commerce in India?
SKU selection and packaging visual design are jointly the most important elements. SKU concentration (3–5 hero products rather than a full catalogue) determines whether velocity builds fast enough for the algorithm to surface the brand organically.
Packaging visual design, specifically how the product image reads at 200x200 pixels on a mobile thumbnail, determines whether advertising spend converts into clicks and sales. Both must be right simultaneously.
Should a new D2C brand treat quick commerce as its primary channel?
Don't use quick commerce as your first or only sales channel. It works best after validating demand through D2C or marketplaces like Amazon, where you've built sales and 50+ reviews.
This gives category managers and algorithms the demand signals they need. Think of Q-commerce as a distribution and growth accelerator, not your first market validation channel.
How many SKUs should a brand list on Blinkit or Zepto when starting out?
3-5 hero SKUs, your highest-velocity products at your most Q-commerce-compatible pack sizes and price points. Listing 15–20 SKUs from day one divides advertising budget, inventory investment and algorithmic signals across too many products to build meaningful velocity on any of them.
The flywheel only starts turning when velocity concentrates. Expand the SKU range after hero SKUs have earned consistent organic positions.
How much should a brand spend on advertising on quick commerce platforms?
Budget for a minimum of 10–15% of projected monthly GMV in advertising during the first 90 days. In competitive categories like personal care, snacks, or beverages on Blinkit or Zepto, ₹30,000–₹60,000 per month per platform is a realistic minimum for building meaningful visibility.
Below this, ad impression share is insufficient to generate the velocity signal the algorithm needs. Add off-platform Meta or Google spend geo-targeted to the brand's dark store pin codes to amplify on-platform velocity at lower effective cost.
How does packaging design affect quick commerce brand performance?
Directly and measurably. Product images appear as small mobile thumbnails (around 200×200 pixels), making click-through rate (CTR) heavily dependent on thumbnail quality.
Since CTR is a key ranking signal on major Q-commerce platforms, products with higher CTR tend to rank better organically over time. Brands that optimize thumbnails for mobile and refine them using seller dashboard CTR data consistently outperform those using standard retail photography.
What is the off-platform demand generation strategy for quick commerce?
Drive traffic from Instagram, YouTube, Meta, or Google Ads to your products on Blinkit, Zepto, or Instamart. Since Q-commerce algorithms reward sales velocity regardless of where demand comes from, off-platform orders boost rankings just like on-platform ones.
Geo-targeting ads to pin codes served by your dark stores makes this especially effective, and combining off-platform with on-platform marketing accelerates growth faster than relying on platform ads alone.
How should a brand use quick commerce data in its broader business strategy?
Q-commerce offers real-time, SKU- and pin-code-level sales data, making it one of the most granular sources of consumer insights in Indian retail.
Use it to identify top-performing variants, high-demand geographies, optimal pack sizes, and peak purchase times, informing product development, retail expansion, packaging, and marketing strategy across channels.
Want strategic branding and packaging like this for your business?





.webp)
.webp)

.webp)
.webp)
.webp)
.webp)
.webp)







.svg)
.webp)


