Do customers ignore your products?
Analyse your packaging performance for free

Analysing The Packaging For Neutrogena, A Global Skincare Brand!

About Neutrogena

Neutrogena has been leading the global skincare market with their effective and approachable skincare products.
Their acne-treatment range is a global best-seller. It’s a brand that’s loved by all and today we will use our packaging prediction model to analyse what makes their products fly off the shelves!

Confetti’s Packaging
Prediction Model™

Imagine you have multiple designs for your latest product packaging. How do you decide which one to go forward with?
Based on our research, out of 72 brands, 89% of them simply launched the product in the packaging that the “founder found beautiful”. No wonder they have a hard time selling.
Our Packaging Performance Model™ changes that!

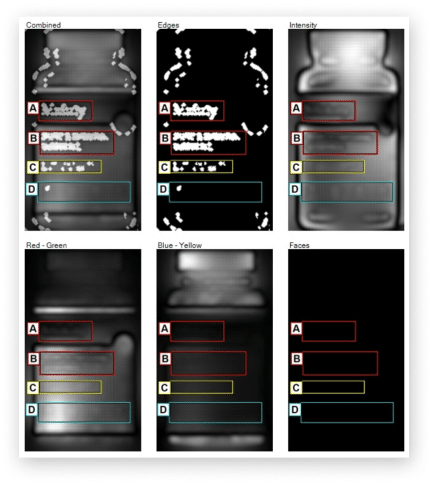
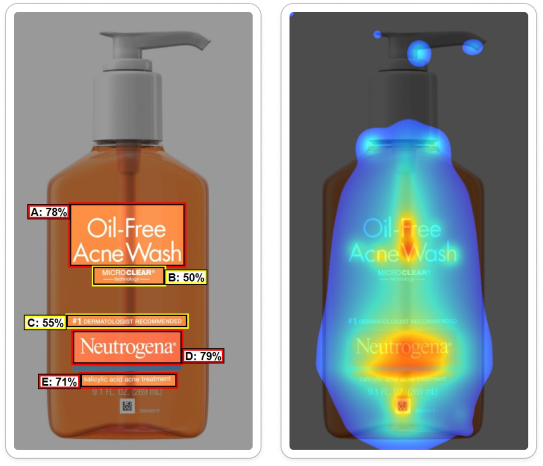
Predict Packaging Performance With A
92% Accuracy

Our packaging prediction model is mapped by the research done by 3M as well as more than 30,000 focus groups conducted in-house.
After using eye-tracking device and real FMCG data points, we have been able to create a prediction model that provides reliable results every time!

Our Reliable Process

Our unique process is built in sync with 3M & Open AI and the results have been validated by more than 3,00,000 customers based on real eye-tracking exercises and focus groups!

The Analysis

Neutrogena x Confetti
STEP 1

Understanding Their Ideal Customer

Based on our research, Neutrogena’s ideal customer profile is college going females who are suffering from acne and oily skin.
This information allowed us to create the initial user persona. It includes a user’s demographic, paying capacity, awareness about the product, etc.
We call this “Information Set 1.”
STEP 2

Studying The Product

Once we studied the user, it’s time for us to analyse the product within the Industry it operates in. This includes answering the question around it’s price point, the legacy of it’s brand, how competitive the Industry is, etc.
Approx 10 data points are collected for the product which is condensed into “Information Set 2”

“Unique Purchase Drivers”

This is what your customer should see...
Data available in Information Set 1 and 2 was passed through our algorithm to Identify the unique purchase drivers (UPD) for the ideal users when they are looking to buy a skin-care related product. Here is what we found
STEP 2

Finding Unique
Purchase Drivers (UPD)

Through our analysis algorithm, we found out these to be the purchase drivers along with their necessary visibility:
  • Brand name (80%) -> UPD
  • USP (70%) -> UPD
  • Product name (55%)
  • Key benefits of the product (75%) -> UPD
  • Ingredients (40%)
  • Price (30%)
  • Origin (10%)
Purchase drivers with the highest suggested visibility become the UPD.

“Current Purchase Drivers”

This is what you are showing...
The current design and how different information is laid out changes how a user looks at the product. The information with a better hierarchy has more changes of being noticed. The information that has the highest hierarchy is called “Current Purchase Driver” (CPD).
Basically, this is what the brand is showing in their packaging.
STEP 4

Finding Current Purchase Drivers (CPD)

We use eye-tracking technology which is validated by real-life user tests to create a packaging heatmap. This heatmap summarises what the user is most likely to see and what they might ignore.
This is what the heatmap for Neutrogena looked like!

Custom Purchase Drivers For Neutrogena

Based on the heatmap analysis, the CPD for Neutrogena were:
  • Brand name (79%)
  • USP (50%)
  • Product name (70%)
  • Key benefits of the product (71%)
  • Ingredients (NA%)
  • Price (NA%)
  • Origin (NA%)
This means the current packaging design of Neutrogena is primarily showing these 3 elemenst!

Measuring Purchase Affinity

UPD = CPD

This means what the customer wants to see is what the product is showing!

High Purchase Affinity
UPD CPD

This means what your product is showing what the customer does not want!

Low Purchase Affinity

Extremely High
Purchase Affinity!

We observed that Neutrogena’s product demonstratges CPD that is extremely close to the UPD that we found earlier for their Ideal customers.
This hints towards a high purchase affinity by this type of user.
This is an amazing achievement for Neutrogena as how they demonstrate understanding user’s needs through minimalist product packaging which still sells more than any other product!

This is what makes an Industry Leader!

Relying on objective methods to evaluate packaging designs is better than guesswork.
Big brands and Industry leaders know this but small-mid sized brands do not.
And we’re here to help you… so you can build an Iconic and best-selling brand that users love!

When To Use Measure
Packaging Performance?

Choosing the right designs
Confused which packaging design to choose? Measure their purchase affinity and make a smart choice!
Competitor Analysis
See where your competitor is outperforming you and attracting users and build your strategy accordingly!

When Creativity Meets Science

Our approach to packaging design brings the perfect blend of science ,data analytics and creativity. This combination has brought our clients massive sucess on the shelves, and has made us a leader in this area!

Want to grow your FMCG brand?

Fill the form below and let’s get on a quick call to see how we can help you!

Type of project